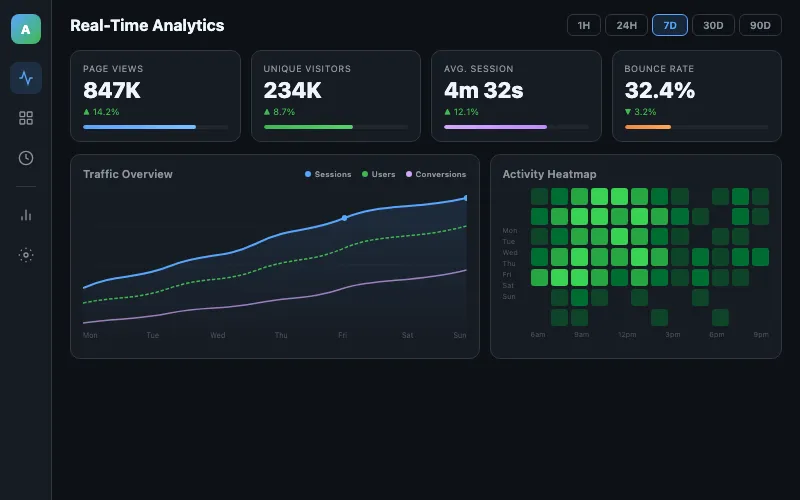
Analytics Dashboard
Analytics
We centralize your metrics from any source, legacy Excel, databases, APIs, or cloud services, into visual, interactive, real-time control panels.
A business dashboard is a visual control panel that consolidates data from multiple sources into a single, interactive interface. At IQ Source, we specialize in connecting any data source, from legacy Excel spreadsheets and SQL databases to REST APIs, cloud services like AWS, Google Cloud, or Azure, and platforms like Salesforce, HubSpot, or SAP. We transform scattered data into clear visualizations that enable instant, informed decision-making.
Monitor critical KPIs instantly with data automatically updated from all your sources, without waiting for manual reports.
Identify trends, anomalies, and opportunities through interactive visualizations that reveal hidden patterns in your data.
We connect any data source: Excel, Google Sheets, SQL/NoSQL databases, REST APIs, ERPs, CRMs, and cloud services.
Each dashboard is designed specifically for your business, with the metrics, alerts, and views each role needs.
See the potential of a custom dashboard for your business
Analytics
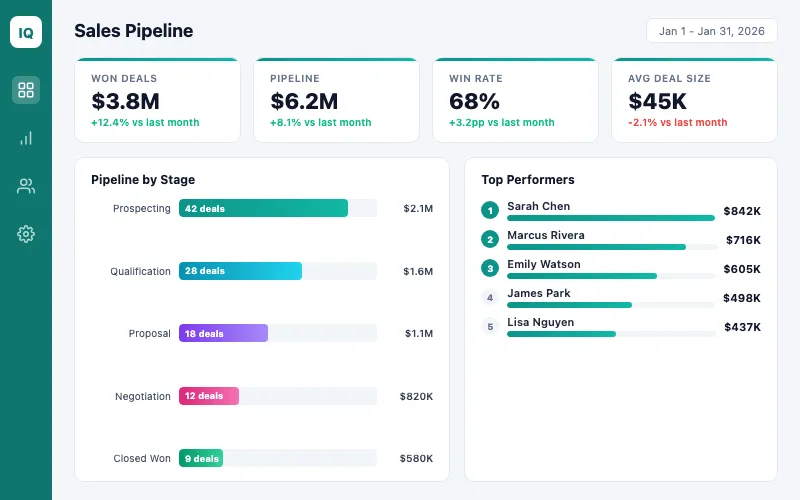
Sales
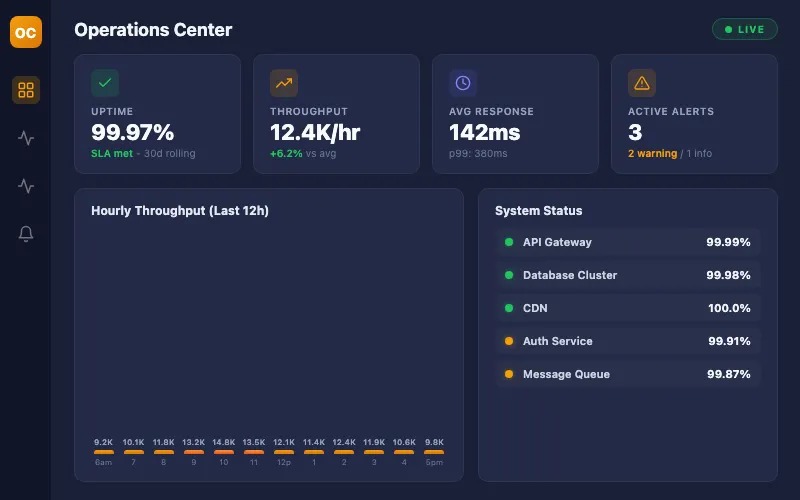
Operations
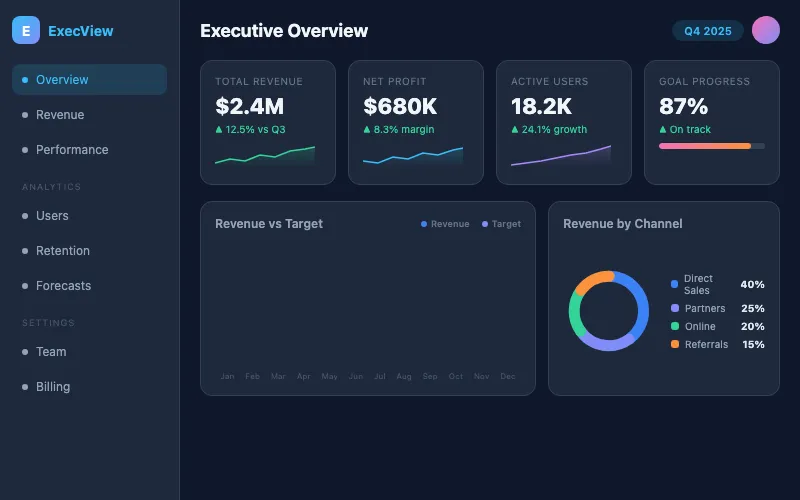
Executive
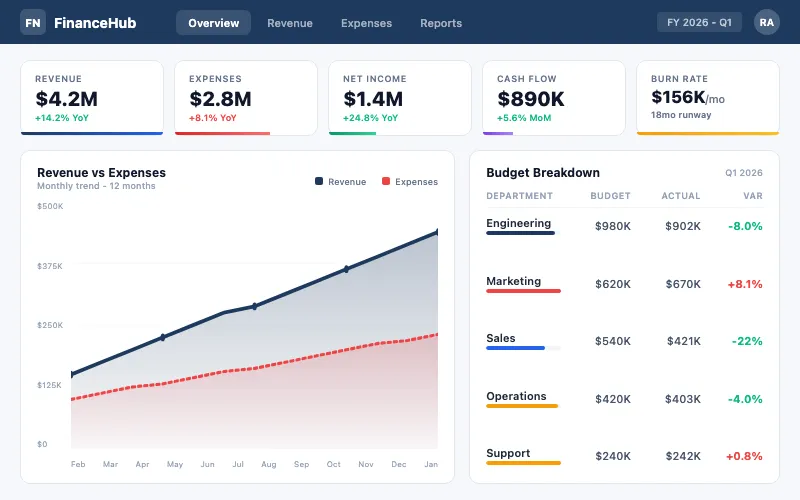
Finance
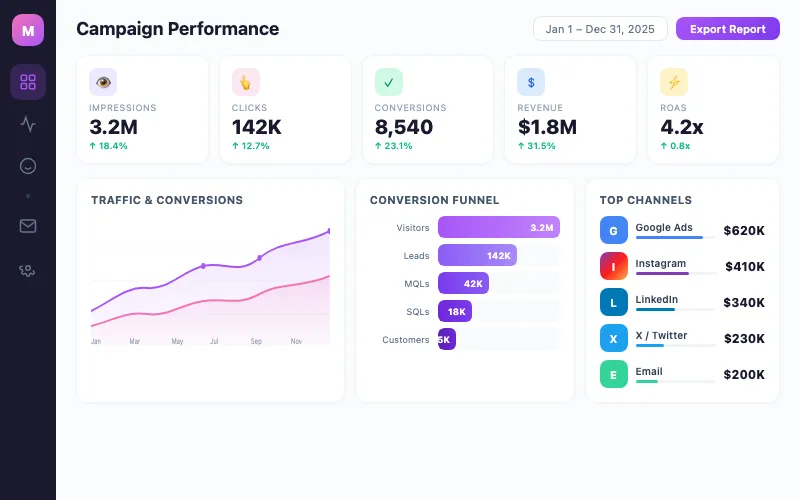
Marketing
Explore a real interactive dashboard. No registration, no commitment, just click and experience what we can build for your business.
We identify your key metrics, existing data sources, and the business objectives the dashboard must address.
We create wireframes and prototypes optimized for rapid data interpretation, with clear visual hierarchies.
We build the dashboard connecting all your data sources, implementing real-time updates and interactive filters.
We deploy on your preferred infrastructure and train your team to use every dashboard feature.


Repuestos COYBO Automotive
1M+
records analyzed
95%
time reduction
Minutos
to send quotes

Intellisense Systems Defense & Meteorology
5
delivery phases
2
device types
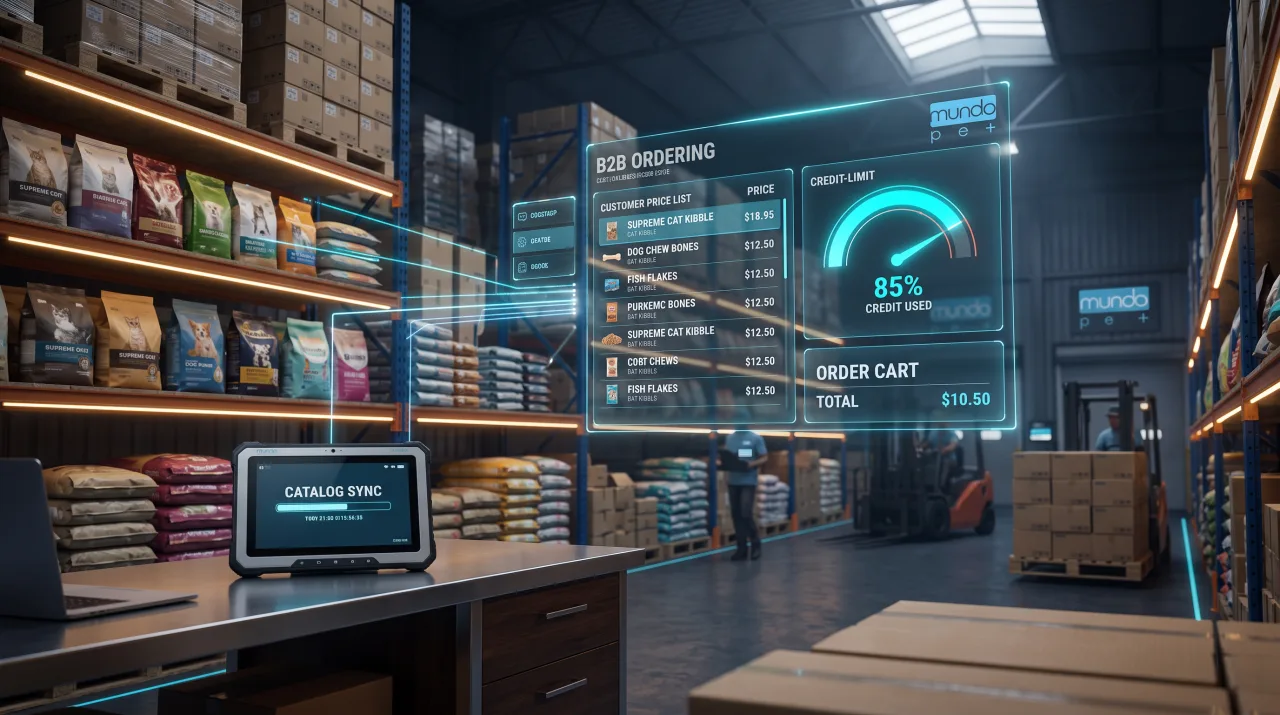

Mundo Pet E-Commerce
2,400+
products
15 min
ERP Sync
12
weeks delivery
Generic templates limit visible metrics and don't adapt to your workflows. A custom dashboard is designed around your specific KPIs, connects exactly the data sources you use, and presents information in the format your team needs for rapid decision-making.
Virtually any source: Excel and Google Sheets, SQL databases (MySQL, PostgreSQL, SQL Server) and NoSQL (MongoDB, Firebase), REST and GraphQL APIs, ERPs like SAP, CRMs like Salesforce or HubSpot, cloud services (AWS, Google Cloud, Azure), and analytics platforms like Google Analytics.
Yes. We configure update frequency based on your needs: from real-time streaming to scheduled intervals (every minute, hour, or day). We also include automatic alerts when KPIs exceed defined thresholds.
All our dashboards are responsive and automatically adapt to any screen: desktop, tablet, or mobile. We can also develop dedicated mobile apps for quick access to critical metrics.
Fill out the form and an expert will contact you to discuss your needs